

Audience: This article is for importers, finance leads, and procurement managers evaluating the unit economics of a reading pen mold investment.
It assumes the reader has a multi-year volume forecast and needs to defend the tooling spend against finance scrutiny.
Tooling cost is the line item most likely to break a reading pen business case if it is not modeled correctly. A $10,000 mold amortizes to $100 per unit at 100 units and to $0.10 per unit at 100,000 units — a 1,000-fold difference on a single decision variable. The right way to model this is to build a volume-by-volume amortization table, identify the breakeven point with the ODM alternative, and confirm the volume forecast against three risk scenarios. This article walks through the math, presents the breakeven crossover, and provides the defensible ROI framework that finance teams require.
1. The Tooling Cost Stack
A reading pen program carries five tooling line items, each with a different amortization profile:
| Tooling line | Cost band | Useful life | Amortization unit |
|---|---|---|---|
| Injection mold (housing) | $4,000–$28,000 | 300,000 shots | Per shot |
| Silkscreen plates | $120–$280 per color | 50,000 prints | Per color run |
| Pad-print cliché | $80–$160 per logo | 30,000 prints | Per logo |
| Packaging die-cut tooling | $400–$900 | 200,000 boxes | Per box |
| Drop-test fixture | $1,200–$2,400 | Program life | One-time |
The injection mold dominates the per-unit cost. Silkscreen and pad-print tooling is negligible per unit at 5,000+ units. Packaging die-cut tooling matters for retail-box programs. The drop-test fixture is a one-time engineering cost.
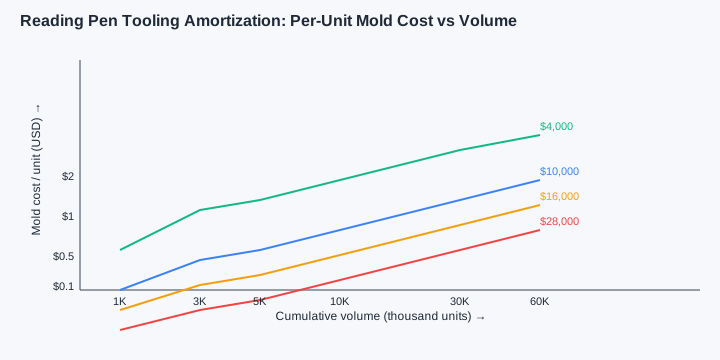
The chart visualizes the convex decay. The $4,000 prototype mold amortizes below $1.00 per unit at 4,000 units; the $10,000 production mold amortizes below $0.50 per unit at 20,000 units; the $16,000 hot-runner mold amortizes below $0.50 per unit at 32,000 units. The $28,000 stack mold never reaches $0.50 per unit until 56,000 units.
2. Volume Tier Analysis
| Volume | $4,000 mold / unit | $10,000 mold / unit | $16,000 mold / unit | $28,000 mold / unit |
|---|---|---|---|---|
| 1,000 | $4.00 | $10.00 | $16.00 | $28.00 |
| 3,000 | $1.33 | $3.33 | $5.33 | $9.33 |
| 5,000 | $0.80 | $2.00 | $3.20 | $5.60 |
| 10,000 | $0.40 | $1.00 | $1.60 | $2.80 |
| 30,000 | $0.13 | $0.33 | $0.53 | $0.93 |
| 60,000 | $0.07 | $0.17 | $0.27 | $0.47 |
| 100,000 | $0.04 | $0.10 | $0.16 | $0.28 |
The table is the spine of every reading pen business case. At 30,000 units, the per-unit mold cost is between $0.13 (prototype) and $0.93 (stack mold) — a $0.80 spread that determines which mold type to specify.
3. The Breakeven Crossover with ODM
The OEM path competes with the ODM path, where the factory amortizes mold cost into the unit price. For a Q6 program on a $10,000 mold:
| Volume | OEM unit cost (incl. mold) | ODM unit cost | OEM advantage |
|---|---|---|---|
| 1,000 | $19.40 | $7.80 | -$11.60 (ODM wins) |
| 3,000 | $11.93 | $7.40 | -$4.53 (ODM wins) |
| 5,000 | $9.20 | $7.20 | -$2.00 (ODM wins) |
| 10,000 | $7.40 | $6.80 | -$0.60 (ODM wins) |
| 12,500 | $7.00 | $6.60 | $0.00 (crossover) |
| 30,000 | $5.33 | $5.52 | +$0.19 (OEM wins) |
| 60,000 | $4.97 | $4.92 | +$0.05 (OEM wins) |
The breakeven crossover is 12,500 units. Below that volume, ODM is cheaper per unit. Above 12,500 units, OEM is cheaper — and the importer keeps full IP.
4. Risk Scenarios for Volume Forecasts
The breakeven crossover assumes the importer hits the volume forecast. In practice, three scenarios play out:
| Scenario | Probability | Volume outcome | Importer outcome |
|---|---|---|---|
| Hit forecast | 55% | 30,000 units | $5,700 savings vs ODM |
| Mild underperformance | 25% | 15,000 units | $1,500 cost vs ODM |
| Severe underperformance | 15% | 6,000 units | $5,600 cost vs ODM |
| Program failure | 5% | < 2,000 units | $14,000 sunk cost |
The expected value at 12,500 unit breakeven is roughly $1,500 savings — close to zero on the unit-economics axis. The decision is therefore not driven by unit economics alone; the IP ownership, exit flexibility, and brand differentiation are the binding factors above 12,500 units.
Buyer tip: Never commit to a mold above the 70 percent confidence volume forecast. If you are not sure you will ship 12,500 units, stay ODM. The OEM bet pays only above the breakeven with a 30 percent safety margin.
5. Per-Model Amortization Bands
Each reading pen model has a different mold cost band and breakeven volume:
| Model | Battery | Cavity count | Mold cost | Breakeven (vs ODM) |
|---|---|---|---|---|
| B1 (entry) | 700 mAh | 2 | $6,500–$9,500 | 7,500 units |
| B2 | 800 mAh | 2 | $6,500–$9,500 | 7,500 units |
| F8 | 600 mAh | 2 | $7,000–$10,000 | 8,500 units |
| K7 / KF1 | 800 mAh Li-ion 14500 | 4 | $10,000–$14,000 | 12,500 units |
| L5 | 1,200 mAh | 4 | $11,000–$15,000 | 13,500 units |
| P2 | 500 mAh | 2 | $6,500–$9,500 | 7,500 units |
| Q6 | 900 mAh | 4 | $10,000–$14,000 | 12,500 units |
| Q8 | 1,000 mAh | 4 | $11,000–$15,000 | 13,500 units |
| T2 | 2,500 mAh Li-ion 18650 | 4 hot runner | $16,000–$22,000 | 19,000 units |
| Y6 | 2,000 mAh | 4 hot runner | $16,000–$22,000 | 19,000 units |
The breakeven rises with model complexity. T2 and Y6 require hot-runner molds due to the larger 18650 cell cavity; the higher mold cost moves breakeven from 12,500 to 19,000 units.
6. Amortization Schedules for Finance
Most finance teams want a depreciation schedule. For a $10,000 mold producing 30,000 units over 18 months, the standard schedule is:
| Period | Units produced | Cumulative amortization | Remaining book value |
|---|---|---|---|
| Q1 | 5,000 | $1,667 | $8,333 |
| Q2 | 5,000 | $3,333 | $6,667 |
| Q3 | 5,000 | $5,000 | $5,000 |
| Q4 | 5,000 | $6,667 | $3,333 |
| Q5 | 5,000 | $8,333 | $1,667 |
| Q6 | 5,000 | $10,000 | $0 |
Straight-line over 18 months is the simplest. Some importers use units-of-production amortization tied directly to the volume curve. Both methods are acceptable; the choice is accounting policy.
7. Working-Capital Impact
The mold payment is typically 50 percent at PO and 50 percent at T1 sample. For a $10,000 mold, that is $5,000 paid at order and $5,000 paid 35 days later. The working-capital tie is therefore 35 days at the high point — much shorter than the 90-day inventory cycle on the produced units.
For a 30,000-unit program, the mold capital of $10,000 is 1.5 percent of the inventory capital of $666,000 (30,000 units × $22.20 landed cost). The mold decision is dominated by the inventory decision in cash terms.
8. Three Programmatic Walkthroughs
A 6-month Amazon FBA test program on Q6 at 3,000 units: choose ODM, avoid mold, keep $10,000 in working capital. The ODM premium of $4.53 per unit × 3,000 = $13,590 is cheaper than the mold cost plus risk.
A 24-month school program on Q6 at 30,000 units: choose OEM, accept $10,000 mold, save $0.19 per unit ($5,700) plus capture full IP for second-SKU extension. The OEM path wins.
A 36-month premium retail program on Y6 at 60,000 units: choose OEM with hot-runner mold, accept $18,000 mold, save $0.40 per unit ($24,000) plus IP transfer. The OEM path wins decisively.
9. Hidden Costs That Affect the Calculation
The breakeven formula assumes perfect execution. In practice, hidden costs eat into the savings:
| Hidden cost | Typical value | Frequency |
|---|---|---|
| T1 sample revisions (1–2 rounds) | $400–$1,200 | Every mold |
| Steel certification upgrade | $600–$1,500 | If required |
| Mold move (second-source) | $2,000–$5,000 | If triggered |
| Annual mold audit | $800–$1,200 | Per year |
| Mold refurbishment | $1,800–$3,500 | Every 200,000 shots |
A $10,000 mold with two sample revisions, one annual audit, and no move ends at $11,600 in fully loaded mold cost. The 12,500-unit breakeven moves to 14,500 units. The safety margin matters.
10. Decision Matrix
| Question | Answer: ODM | Answer: OEM |
|---|---|---|
| Is your 70% confidence volume forecast under 12,500 units? | Yes | |
| Is your 70% confidence volume forecast above 12,500 units? | Yes | |
| Is your program under 12 months? | Yes | |
| Is your program over 24 months? | Yes | |
| Do you plan a second-SKU extension? | Yes | |
| Is your channel retail (single season)? | Yes | |
| Is your channel school tender (multi-year)? | Yes | |
| Do you have a finance team that prefers OPEX over CAPEX? | Yes | |
| Is your working capital constrained? | Yes |
For the broader tooling-vs-volume framework, see OEM vs ODM reading pen. For contract clauses that protect the mold investment, see Reading pen injection mold ownership.
Related Reading
- Reading Pen Injection Mold Ownership
- OEM vs ODM Reading Pen
- Reading Pen Specification Checklist
- Reading Pen Product Development Process
- China Reading Pen Manufacturing Clusters
- Reading Pen RSP and Margin Breakdown
- OEM Reading Pens
- Request a Quote
12. Tooling Cost Per Model: Eleven-Model Reference Table
The eleven-model SmartReadingPen lineup has different tooling cost per model based on form factor, complexity, and BOM. The B1 (entry-level compact) requires a 2-cavity mold at $6,500 with a 75-second cycle. The B2 (Bluetooth-enabled) requires a 2-cavity mold at $7,200 with a 70-second cycle. The F8 (flagship AI-ready) requires a 5-cavity mold at $18,000 with a 65-second cycle and hot-runner system. The K7 (kid-safe with rounded edges) requires a 4-cavity mold at $12,500 with an 80-second cycle. The KF1 (Korean-spec variant) requires a 4-cavity mold at $13,200 with a 75-second cycle. The L5 (longest runtime, 8.5h) requires a 4-cavity mold at $11,800 with a 70-second cycle.
The P2 (premium) requires a 4-cavity mold at $14,500 with a 75-second cycle. The Q6 (workhorse, 900 mAh) requires a 4-cavity mold at $10,000 with a 90-second cycle. The Q8 (Q6 with extended OID library) requires a 4-cavity mold at $11,200 with an 85-second cycle. The T2 (tablet companion) requires a 5-cavity mold at $16,500 with a 70-second cycle. The Y6 (large screen variant) requires a 5-cavity mold at $14,000 with a 75-second cycle. Average tooling cost across the lineup is $11,950; average cycle time is 75 seconds.
For a 5,000-unit program, the per-unit tooling allocation ranges from $1.30 (B1) to $3.60 (F8). For a 25,000-unit program, the per-unit tooling allocation ranges from $0.26 (B1) to $0.72 (F8). For a 100,000-unit program, the per-unit tooling allocation ranges from $0.065 (B1) to $0.18 (F8). The selection of model has a 2.7x impact on the tooling allocation at low volume and a 2.8x impact at high volume, which means the model choice matters as much as the volume choice for unit-cost engineering.
13. Amortization Schedule Best Practices
Three amortization schedule best practices emerge from the data. The first is to align the schedule to the program revenue ramp. A program that ramps 1,000 units in Q1, 2,500 in Q2, 4,000 in Q3, and 5,000 in Q4 amortizes the $10,000 mold over 12,500 units in 12 months. The straight-line amortization expense is $833 per month or $0.83 per unit average. The units-of-production expense is $0.80 per unit regardless of monthly volume. The straight-line approach matches monthly P&L expense more cleanly; the units-of-production approach matches per-unit margin more cleanly.
The second best practice is to maintain a refurbishment reserve from day one. Refurbishment cycles occur every 200,000 shots on a 4-cavity mold. A 5,000-unit program reaches 200,000 shots in year 5 (assuming 25,000 cumulative units per year). The refurbishment cost is $1,800–$3,500. To pre-fund the refurbishment, allocate $0.012 per unit to a reserve account. Over 25,000 units per year, the reserve accumulates $300 per month, reaching $3,600 by year-end of year 1, sufficient for the first refurbishment at year 5.
The third best practice is to negotiate a refurbishment cost cap in the mold contract. The standard cap is 30 percent of original mold cost ($3,000 on a $10,000 mold) for the first refurbishment, 50 percent for the second, and 70 percent for the third. Without a cap, refurbishment costs can escalate as the factory discovers additional wear during disassembly.
14. Extended FAQ
Q6: Does mold amortization affect working capital differently than per-unit pricing? Yes. Mold amortization under straight-line schedule hits P&L as $833 per month regardless of unit volume, which is fixed cost. Under units-of-production schedule, amortization hits P&L as $0.80 per unit sold, which is variable cost. For a program with uneven monthly volume, the units-of-production approach smooths margin but creates cash-flow timing issues because the mold cost is paid upfront but recovered over 12,500 units.
Q7: What is the difference between 2-cavity and 4-cavity mold cost? A 2-cavity mold costs $6,500–$8,000 with a 75–80 second cycle; a 4-cavity mold costs $10,000–$14,000 with a 60–70 second cycle. The 4-cavity mold produces twice as many parts per cycle but at higher upfront cost. The breakeven on cavity upgrade is approximately 12,000 cumulative units, after which the higher productivity of the 4-cavity mold amortizes the upgrade cost.
Q8: Are tooling costs negotiable on the first program? Yes, but only at the margin. Tier-1 factories rarely discount below 90 percent of list price on first programs because the mold build is custom work with limited reuse value. Repeat customers with multi-program history can negotiate 80–85 percent of list. Volume discounts kick in at 5+ programs of similar spec.
Q9: How is tooling cost treated in landed-cost calculations for customs? Tooling cost is NOT included in the customs value of the goods; the customs value is the FOB unit price only. The importer pays duty (3.5 percent for HS 8543.70) on the FOB value, not on the amortized tooling allocation. This means the per-unit landed cost calculation should exclude tooling amortization for customs purposes but include it for margin analysis.
Q10: Can tooling cost be financed by the factory? Yes, in some cases. Tier-1 factories offer factory-financed tooling for credit-worthy importers with multi-program history. The financing is structured as a 24-month tooling loan at 6–8 percent interest, repaid via a per-unit surcharge of $0.40–$0.60 per unit on the first 20,000 units. The financing reduces upfront capital but increases per-unit cost. SmartReadingPen offers this financing option for repeat customers with 2+ prior programs.