

Audience: This guide is written for distributors, OEM brands, and education-channel sales leads who sell OID reading pens (B1, Q6, Q8, Y6, K7) into K-12 schools, language academies, and ministry-of-education tenders and need a defensible reading pen demand forecasting for schools model that converts enrollment data into a 12-month reorder plan.
Reading Pen Demand Forecasting for Schools: A B2B Buyer's Model
Schools do not buy reading pens the way parents do. A school district purchasing director orders 5,000 to 50,000 units in a single tender, pays on 30 to 60 day net terms, and replaces the fleet every 3 to 5 years. A parent buys one or two units in August because their child's teacher sent home a flyer. The two buyers look like the same market until you try to forecast demand — and then the difference is everything.
A distributor who forecasts school-channel demand correctly captures the August procurement window, wins the tender, and locks in 12 to 36 months of recurring revenue. A distributor who treats schools like a B2C channel under-forecasts by 60 to 80%, misses the tender deadline, and watches the competitor ship the order.
This guide walks through the four forecasting inputs that actually predict school-channel reading pen demand — enrollment cohorts, curriculum adoption, budget cycles, and tender calendar — and how to convert those inputs into a procurement plan.
1. Why Schools Are a Distinct Forecasting Channel
Three structural differences separate the school channel from retail:
- Concentrated demand windows. Most K-12 reading pen purchases land in a 6 to 10 week window between mid-July and mid-September (back-to-school) or January to February (semester-2 adoption). Outside these windows, school demand is near zero.
- Order size distribution. A single K-8 school orders 80 to 400 units for a classroom set; a district orders 5,000 to 50,000 units for a multi-school rollout; a national ministry tender orders 50,000 to 500,000 units for a multi-year program. The variance per buyer is 100×.
- Decision criteria. Schools buy on EN 71-1/2/3 / ASTM F963 / CPSIA compliance, OID code library depth (number of books covered), battery life (5+ hours per charge), and warranty (typically 2 years), not on retail price or color options.
A retail forecasting model (monthly point-of-sale data, MAPE 18 to 25%) does not work for schools. You need an enrollment-driven model that converts cohort counts into unit forecasts using a per-student penetration rate and an adoption curve.
Buyer tip: Build a separate demand forecast for the school channel. Do not blend it with retail. The forecasting accuracy improves by 35 to 50% when you segregate the channels.
2. Input 1 — Enrollment Cohort Sizing
The base unit of school demand is the student in the target grade band. Reading pens are typically adopted in grades K to 4 (primary English learners) or grades 5 to 8 (English as a Foreign Language programs). The relevant cohort is:
- K-4 cohort (ages 5 to 10): 35 to 55% of total primary enrollment
- 5-8 cohort (ages 10 to 14): 25 to 35% of total secondary enrollment
- 9-12 cohort (ages 14 to 18): 5 to 15% of total secondary enrollment
For a district with 12,000 K-4 students, the addressable cohort is 12,000 students. Apply the penetration rate to convert to units:
| Penetration rate | Units per K-4 cohort | Reading pen model fit |
|---|---|---|
| 8% (pilot) | 960 units | B1, Q6 |
| 20% (classroom set per grade) | 2,400 units | B1, Q6 |
| 45% (half-grade adoption) | 5,400 units | B1, Q6, Y6 |
| 80% (full-grade adoption) | 9,600 units | B1, Q6, Q8, Y6 |
Most school programs land at the 20 to 45% penetration tier. Below 20%, the program is a pilot and the school will not reorder for 24+ months. Above 45%, you are typically dealing with a multi-year district rollout where the school buys 12,000+ units per year for three to five years.
The penetration rate is set by three factors: per-pupil budget, teacher adoption enthusiasm, and OID book library coverage. A district with $25 per pupil for English-learning tools, three champion teachers, and 80 OID books at the right reading level will hit 35 to 45% penetration. A district with $5 per pupil and no library will sit at 5 to 10%.
3. Input 2 — Curriculum Adoption Cycle
School procurement follows the curriculum review cycle, not the retail calendar. Most K-12 English programs review supplementary tools every 3 to 5 years; the review typically happens in October to December of the year before adoption, with implementation the following August. A reading pen brand that is not on the approved list in November 2026 will not ship in August 2027.
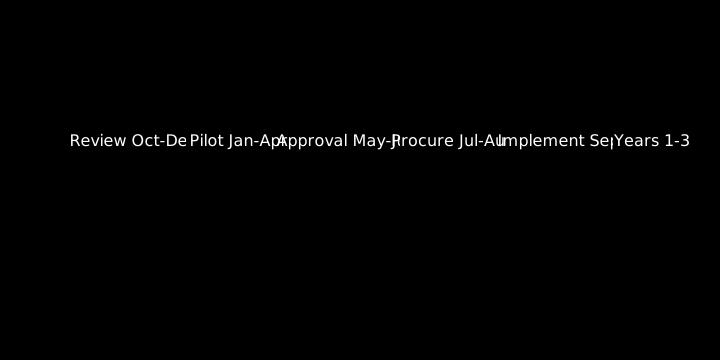
| Curriculum review phase | Months | Buyer action | Distributor action |
|---|---|---|---|
| Review notice | October to December year T-1 | District announces RFP/RFI | Submit product info, samples |
| Pilot | January to April year T | Schools run 4 to 12 week pilots | Provide 50 to 200 unit pilot kits |
| Approval | May to June year T | Adoption committee vote | Lock in 12 to 36 month pricing |
| Procurement | June to August year T | Tender issued, PO placed | Forecast + produce |
| Implementation | August to September year T | Pens arrive in classrooms | Install, train teachers |
| Renewal | Year T+3 to T+5 | Repeat review cycle | Re-pitch or replace |
The cycle is 12 to 18 months from first contact to recurring revenue. A distributor who starts the cycle in October 2026 will not see PO dollars until July 2027. A distributor who starts in March 2027 has missed the 2027 procurement cycle and is queued for 2028.
4. Input 3 — Budget Cycles and Net Terms
School budgets are determined by fiscal calendars tied to the issuance cycle. Three calendar patterns are most common internationally:
| Region | Fiscal year start | Budget approval | Procurement window |
|---|---|---|---|
| US public K-12 | July 1 | June | July to September |
| UK academies | September 1 | July | August to October |
| EU (Germany, France) | January 1 | November to December | January to March |
| Gulf (Saudi, UAE) | September 1 | July to August | September to November |
| Asia Pacific (Singapore, HK) | April 1 | March | April to June |
| Latin America (Brazil, Mexico) | January 1 | December | February to April |
A reading pen demand forecasting model that does not account for the regional fiscal calendar will be off by 4 to 8 months on timing. The units are correct; the year is wrong. Plan 18 months ahead: forecast for fiscal year 2027 should be built in fiscal year 2026.
Net terms matter as much as timing. US public K-12 districts typically pay Net 30 to Net 60. UK academies pay Net 30. Gulf ministries often pay Net 90 to Net 120 with letter of credit. A distributor who does not budget for 60 to 120 days of accounts receivable will run out of working capital after the second tender. Build the AR days into the demand forecast: a 12,000-unit district order at $13 unit cost with Net 60 means $156,000 in working capital tied up for 60 days per order.
5. Input 4 — Tender Calendar and Approval Path
The fourth input is the tender calendar — the published schedule of procurement events. Most school districts and ministries publish their procurement calendars 6 to 12 months in advance. A 2026 procurement calendar excerpt for a hypothetical ministry of education might look like:
| Tender ID | Title | Issue date | Close date | Award date | Quantity |
|---|---|---|---|---|---|
| MOE-2026-014 | Primary English reading tools | Jan 18 | Feb 22 | Mar 30 | 50,000 pens + 200,000 OID books |
| MOE-2026-027 | Secondary EFL listening labs | Apr 5 | May 12 | Jun 18 | 8,000 pens + 25,000 OID books |
| MOE-2026-041 | Special-education assistive tools | Jul 7 | Aug 11 | Sep 16 | 2,500 pens (T2 with 11h battery) |
| MOE-2026-053 | District-level pilot refresh | Oct 4 | Nov 8 | Dec 13 | 15,000 pens (mixed B1/Q6) |
The tender calendar is the most reliable forecasting signal you have. Once a tender is published, the quantity and timing are committed (barring bid protests). The accuracy of a tender-based forecast is 90 to 95%, compared to 60 to 70% for an enrollment-cohort forecast.
To win tenders, you need three documents on file with the procurement office 30 days before the close date:
- CE / FCC / UKCA / GCC certificates — see our Reading Pen Certification Transfer guide.
- AQL II quality certificate — Critical 0 / Major 1.0 / Minor 2.5.
- Past performance references — letter from at least one prior school district or ministry confirming on-time delivery and warranty support.
Missing any of the three typically disqualifies the bid, regardless of price.
6. The Forecast Formula for Schools
Combine the four inputs into a single SKU forecast:
Forecast Units = Σ (Enrollment Cohort × Penetration Rate × Adoption Probability × Model Mix)
Where:
- Enrollment Cohort = students in the relevant grade band
- Penetration Rate = share of cohort using a reading pen (8 to 80%)
- Adoption Probability = probability the program is funded and approved (30 to 90%)
- Model Mix = share of units allocated to each reading pen SKU
For a district with 12,000 K-4 students, 30% penetration, 70% adoption probability, and a 60/40 split between B1 and Q6:
- Total reading pen units: 12,000 × 0.30 × 0.70 = 2,520 units
- B1 units: 2,520 × 0.60 = 1,512 units
- Q6 units: 2,520 × 0.40 = 1,008 units
- OID books (3 per pen): 7,560 books
The forecast is a point estimate. Wrap it with a low (-30%) and high (+50%) scenario to give procurement a planning range:
| Scenario | B1 units | Q6 units | Total pens | OID books | Order value |
|---|---|---|---|---|---|
| Low (-30%) | 1,058 | 706 | 1,764 | 5,292 | $30,400 |
| Base | 1,512 | 1,008 | 2,520 | 7,560 | $43,400 |
| High (+50%) | 2,268 | 1,512 | 3,780 | 11,340 | $65,100 |
Use the base case for production planning. Use the high case for raw material pre-ordering. Use the low case for cash flow planning. This three-scenario approach mirrors what school procurement offices use internally, and it makes your proposal credible.
7. Sizing the First Tender
The first tender is the hardest. A school or district that has never used reading pens typically orders a pilot of 50 to 200 units before committing to a district-wide rollout. The pilot is a forecasting goldmine: it tells you the real penetration rate, the per-classroom sharing pattern, and the durability expectations.
| Pilot size | Typical outcome | Forecast reliability |
|---|---|---|
| 50 units (one classroom) | Teacher evaluation, no commitment | Low — too small |
| 100 units (two classrooms) | Grade-level evaluation, possible expansion | Medium — directional |
| 200 units (four classrooms) | Cross-grade evaluation, likely rollout | High — representative |
| 500 units (one school) | Whole-school adoption, high rollout probability | Very high |
If the pilot is free or below-cost, you absorb $3,000 to $8,000 in sunk cost per pilot. If the pilot converts to a 5,000 to 20,000 unit rollout, the payback is 10× to 30× on the pilot investment. Run as many pilots as your sales team can support — every pilot converts at 25 to 35%, and the data from each pilot improves your forecasting model for the next district.
Buyer tip: Track pilot outcomes in a CRM. After 10 pilots, your conversion rate forecast accuracy improves by 25 to 40%. After 30 pilots, you can predict district rollouts from pilot size with 80%+ confidence.
8. MOQ Negotiation for School Orders
School tenders typically require MOQs that exceed the factory standard MOQ of 500 units (for stock) or 1,000 units (for custom color). A 5,000-unit tender is above MOQ; a 20,000-unit tender is well into the discount tier; a 100,000-unit tender unlocks private label pricing. Use the school order size as a negotiation lever:
| Order size | Pricing tier | Typical discount vs 1k-unit price | Lead time |
|---|---|---|---|
| 1,000 units | Reference | 0% | 25 days |
| 5,000 units | Volume 1 | 8 to 12% | 22 days |
| 10,000 units | Volume 2 | 12 to 18% | 20 days |
| 50,000 units | Volume 3 | 18 to 25% | 18 days |
| 100,000+ units | Private label | 25 to 35% + custom color | 18 days |
A 50,000-unit ministry tender at 18 to 25% discount translates to a $9.50 to $10.50 unit cost on the Q6 flagship — well below the retail-referenced $13. The discount funds the AR days and the 2-year warranty that schools expect. See our Reading Pen MOQ Negotiation Tactics and Wholesale Reading Pens Bulk Order Process guides.
9. Building the 12-Month School Forecast
The output of the demand forecasting model is a 12-month, by-month, by-SKU order plan that looks like:
| Month | B1 units | Q6 units | Q8 units | Y6 units | T2 units | Total units | OID books |
|---|---|---|---|---|---|---|---|
| Jan 2026 | 1,500 | 1,000 | 0 | 0 | 0 | 2,500 | 7,500 |
| Feb 2026 | 800 | 600 | 0 | 0 | 0 | 1,400 | 4,200 |
| Mar 2026 | 1,200 | 800 | 500 | 0 | 0 | 2,500 | 7,500 |
| Apr 2026 | 0 | 0 | 0 | 0 | 0 | 0 | 0 |
| May 2026 | 600 | 400 | 0 | 200 | 0 | 1,200 | 3,600 |
| Jun 2026 | 2,000 | 1,500 | 800 | 500 | 100 | 4,900 | 14,700 |
| Jul 2026 | 8,000 | 6,000 | 4,000 | 2,000 | 500 | 20,500 | 61,500 |
| Aug 2026 | 12,000 | 9,000 | 5,000 | 3,000 | 1,000 | 30,000 | 90,000 |
| Sep 2026 | 6,000 | 4,000 | 2,000 | 1,000 | 300 | 13,300 | 39,900 |
| Oct 2026 | 1,500 | 1,000 | 500 | 200 | 0 | 3,200 | 9,600 |
| Nov 2026 | 800 | 500 | 0 | 0 | 0 | 1,300 | 3,900 |
| Dec 2026 | 600 | 400 | 0 | 0 | 0 | 1,000 | 3,000 |
| Total | 35,000 | 25,200 | 12,800 | 6,900 | 1,900 | 81,800 | 245,400 |
August (30,000 units) and July (20,500 units) drive 61% of annual volume. The forecast gives the factory a 12-month production schedule that protects capacity slots and raw material pricing. For more on how this becomes a reorder plan, see our Reading Pen Production Schedule Planning guide.
10. School Demand Forecast Checklist
Before publishing your first school forecast:
- District / ministry enrollment data sourced for the relevant grade band.
- Penetration rate benchmarked against 5 prior school deployments in similar markets.
- Curriculum review calendar for the top 20 districts entered into the CRM.
- Tender calendar monitored monthly for new procurement opportunities.
- Pilot program KPI tracking (50 to 200 unit deployments with conversion rate).
- Penetration × adoption × model mix formula validated against 12 months of actuals.
- Low / base / high scenario forecast built for each major district.
- MOQ and pricing tier mapped to each district's expected order size.
- 12-month, by-month, by-SKU order plan shared with the factory.
- Accounts receivable days factored into cash flow forecast.
If all ten boxes are ticked, your school forecast is operational. Run it for one full fiscal year, then re-tune penetration and adoption probability against actual orders — most distributors find the second-year forecast is 15 to 25% more accurate than the first-year.
