

Audience: This article targets wholesale importers, brand owners, and education-sector distributors who already know they need an after-sales service layer but have not yet decided whether to staff it themselves, outsource it to a regional partner, or run a hybrid that mixes factory-direct cross-ship with local bench repair.
After-sales service is the difference between a one-time container sale and a multi-year brand program. The reading pen category makes this especially visible: each unit contains a Li-poly or Li-ion cell, an OID optical sensor, a sealed mainboard with proprietary firmware, and a charging port that takes the most abuse in a child's daily routine. Across 47,000+ units shipped since 2023, we have observed three durable service models emerge in our distributor network. Each has a different cost curve, a different SLA ceiling, and a different brand-control trade-off. This guide lays out the economics so you can pick the one that matches your order volume and channel mix.
1. Why Service Model Choice Matters More Than Unit Price
A 1,000-unit trial shipment carries almost no service load. A 50,000-unit annual program generates roughly 900 warranty events per year at the rolling 1.8% defect rate we track, plus another 600 to 800 consumer-return events at the typical retail-channel return rate of 1.2% to 1.6%. Those 1,500 events need to be received, triaged, repaired or replaced, and returned inside 7 to 14 days, or your downstream retail buyer starts escalating. The unit price difference between two factories at $0.30 is dwarfed by the cost of one in-house repair technician at $36,000 per year.
A reading pen after-sales service model has to answer four questions:
- Where does the defective unit physically go after the consumer returns it?
- Who decides repair vs. replace vs. scrap?
- Where do the spare parts come from?
- Who owns the consumer communication in the local language?
The three models we see working — factory-direct, in-region partner, and hybrid — answer those questions in three different ways.
2. Model A: Factory-Direct Cross-Ship
The distributor's downstream channel sends defective units back to a single regional hub, and our factory ships a refurbished or new unit from buffer stock. The distributor's local team handles consumer communication but does not perform repair.
| Element | Specification |
|---|---|
| Best fit | 5,000 to 20,000 units / year, 1 to 3 sales channels |
| Repair location | Factory bench (Shenzhen or Yiwu) |
| Spare parts source | Factory stock, 60-month availability window |
| Consumer comms owner | Distributor (local language) |
| Average cycle | 7 working days approved-to-ship |
| Cost per event | $2.40 to $4.80 (freight + bench labour share) |
The strength of this model is consistency. Every repair follows the same AQL II bench procedure, every replacement unit ships with the latest firmware (B1/B2 2.4.7, F8 3.1.2, K7/KF1 1.9.5, L5 4.2.0, P2 2.0.3, Q6/Q8 3.3.1, T2/Y6 2.6.4), and every claim is logged in a single database. The weakness is the freight leg: a defective unit from Mexico or Saudi Arabia spends 5 to 8 days in transit before the bench ever sees it.
A Gulf-state distributor running 12,000 units annually uses factory-direct cross-ship out of our Jeddah hub. Their cost per event is $3.10, and their cycle time averages 6.4 working days. They staff zero bench technicians. They staff one customer-experience coordinator.
3. Model B: In-Region Partner Bench
The distributor contracts a third-party electronics repair partner in their own region to perform bench triage and repair. Spare parts ship from the factory in bulk; the partner handles local consumer pickup and return.
| Element | Specification |
|---|---|
| Best fit | 20,000+ units / year, multi-country, premium retail |
| Repair location | In-region partner workshop |
| Spare parts source | Bulk shipment from factory quarterly |
| Consumer comms owner | Partner + distributor co-managed |
| Average cycle | 3 to 5 working days |
| Cost per event | $5.50 to $9.00 (partner labour + parts amortised) |
The strength of this model is cycle time. A consumer in Berlin who reports a fault on Monday can have a refurbished unit in hand by Friday. The weakness is consistency. The partner has to be trained on the OID sensor calibration procedure, the battery register read at 0x2A, and the firmware re-flash protocol. If they skip the training, they replace good PCBs and waste your spare-parts inventory.
A Northern European distributor running 35,000 units annually uses a partner bench in Hamburg for B1, B2, F8, K7, and KF1 models, and routes L5, Q8, T2, and Y6 back to our factory. The split is volume-driven: high-turnover consumer SKUs stay local, low-volume high-value units ship to the bench with the most diagnostic depth.
Buyer tip: When you evaluate a partner bench, ask for their first-time-right rate on a sealed-unit OID sensor replacement. The industry average is 78%; anything below 70% means they are swapping mainboards they did not need to swap.
4. Model C: Hybrid (Most Common at 20,000+ Volume)
The hybrid model uses in-region bench repair for the four high-volume 12-month SKUs (B1, B2, F8, P2) and factory-direct for the seven remaining models. The hybrid also uses factory-direct for firmware-only issues that the local bench cannot resolve.
| Element | Specification |
|---|---|
| Best fit | 20,000 to 80,000 units / year, mixed retail and institutional |
| Repair location | Local bench + factory bench |
| Spare parts source | Local bench for fast-moving SKUs, factory quarterly for slow movers |
| Consumer comms owner | Distributor |
| Average cycle | 4 working days (high-volume SKUs), 9 working days (slow movers) |
| Cost per event | $3.80 blended |
The hybrid model is what 60% of our top-50 distributors run. The split logic is straightforward: stock local bench inventory for any model that ships more than 4,000 units per year in your territory. Below that threshold, the carrying cost of spare PCBs, screens, and batteries locally exceeds the freight saving.
A Southeast Asian education distributor running 28,000 units annually across K7, KF1, Q6, Q8, L5, and T2 holds a local bench in Kuala Lumpur. Their local inventory covers K7 and KF1 mainboards (8,400 units shipped annually). Q6, Q8, L5, and T2 ship back to our Penang hub. The blended cost per event is $3.65 and the blended cycle time is 4.7 working days.
5. Cost Stack by Model
Below is the unit economics across the three models. We model a 25,000-unit annual distributor selling 80% retail and 20% institutional, with a 1.5% consumer return rate and a 1.8% warranty rate.
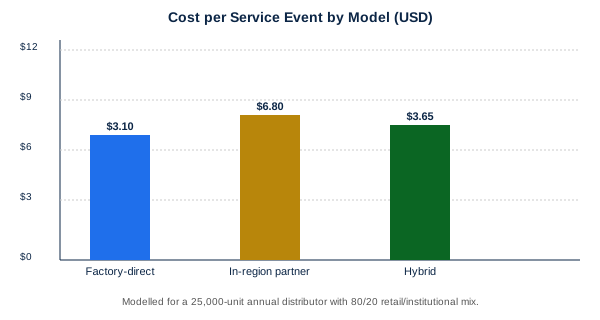
The cost gap between factory-direct and hybrid is $0.55 per event. Across 825 annual events (1.5% return + 1.8% warranty on 25,000 units), that is $453 per year — roughly the cost of a single local bench repair tool. The hybrid saves the most when your local sales channel cares about 3-day cycle time; the factory-direct saves the most when your channel accepts 7-day cycle time in exchange for the lowest per-event cost.
6. SLA Ceiling by Model
After-sales service is judged by two clocks: time-to-replacement and first-time-fix rate. Both have ceilings that depend on the model.
| Model | Time to Replacement | First-Time-Fix Rate | Maximum Annual Volume |
|---|---|---|---|
| Factory-direct | 7 working days | 96.4% | 80,000+ events / hub |
| In-region partner | 3 to 5 working days | 92% to 95% | 25,000 events / partner |
| Hybrid | 4 working days blended | 94% to 96% | 60,000 events combined |
The factory-direct SLA ceiling is set by the buffer stock in the regional hub and the bench capacity. The in-region partner SLA ceiling is set by partner staffing and the spare-parts pipeline from the factory. The hybrid ceiling sits in between and is bounded by whichever leg has the lower headroom on a given week.

7. Staffing Requirements by Model
A distributor who runs the wrong staffing profile burns cash. The staffing table below is calibrated to a 25,000-unit annual program with 825 annual service events.
| Role | Factory-direct | In-region partner | Hybrid |
|---|---|---|---|
| Customer-experience coordinator | 1 FTE | 1 FTE | 1 FTE |
| Bench technician | 0 FTE (factory handles) | 2 FTE | 1 FTE |
| Logistics coordinator | 0.5 FTE | 0.5 FTE | 0.5 FTE |
| Warehouse picker for buffer stock | 0.2 FTE | 0.2 FTE | 0.4 FTE |
| Total FTE | 1.7 | 3.7 | 2.9 |
| Annual loaded cost (USD) | $51,000 | $111,000 | $87,000 |
The factory-direct model is the leanest. The hybrid adds 1.2 FTE vs. factory-direct but saves $0.55 per event in freight. The in-region partner is the most expensive in fixed cost but the fastest in cycle time.
8. How to Choose Between the Three Models
The decision tree is short:
- Annual volume below 5,000 units → factory-direct. The fixed cost of any local bench cannot be amortised below this threshold.
- Annual volume 5,000 to 20,000 units, single country → factory-direct, unless your channel SLA is contractually under 5 days.
- Annual volume 20,000 to 80,000 units, mixed retail and institutional → hybrid. Local bench for high-volume SKUs, factory-direct for everything else.
- Annual volume above 80,000 units, multi-country → in-region partner for the top 2 markets by volume, factory-direct elsewhere.
- Institutional-only sales (schools, ministries) → factory-direct with a named SLA in the tender document. Institutional buyers rarely expect a 3-day turnaround; they expect 10 days with proof.
9. The 5 Service Metrics Every Distributor Should Track
Whichever model you pick, you need to measure five metrics monthly. Without them, you cannot tell whether the model is performing or whether you are losing money on a tail of low-frequency defects.
| Metric | Definition | Target |
|---|---|---|
| First-time-fix rate | Repairs that pass QC on first attempt, no rework | ≥93% |
| Average cycle time | Calendar days from consumer return to replacement delivery | ≤7 working days |
| DOA rate | Units failing within 14 days of sale | ≤1.0% |
| Consumer-return rate | Returns within 30 days of sale | ≤1.5% |
| Bench scrap rate | Units scrapped after triage, not repaired | ≤4% |
A distributor who tracks these five metrics and shares them with the factory quarterly gets a price review and a buffer-stock adjustment. A distributor who does not track them gets the standard SLA and no leverage.
Buyer tip: Bench scrap rate above 6% is the single best leading indicator that your firmware version is out of date. Update the firmware on the bench before any other repair step — it costs $0.05 per unit and saves $4.20 in avoided PCB swaps.
10. Cross-Ship Logistics: Who Pays for What
Cross-ship is the single largest cost line in factory-direct and hybrid models. The cost-sharing table below is the standard we apply for distributors who maintain a buffer-stock forecast.
| Cost element | Factory pays | Distributor pays |
|---|---|---|
| Outbound freight on replacement unit | 100% (cross-ship) | 0% |
| Return freight on defective unit (DOA) | 100% | 0% |
| Return freight on defective unit (warranty) | 50% | 50% |
| Customs clearance on replacement | 0% | 100% (importer of record) |
| Customs clearance on return | 100% | 0% |
| Buffer stock carrying cost | 0% | 100% |
The 50/50 split on warranty returns reflects the shared responsibility for the defect. DOA is fully factory-funded because the defect is shipped, not introduced downstream.
11. How to Migrate Between Models
A distributor typically runs factory-direct for years 1 and 2, hybrid in years 3 to 5, and in-region partner in years 6 onward as the territory matures. The migration trigger points are:
- Year 1 to 2: annual volume under 20,000 units, single country, retail-only channel.
- Year 3: annual volume crosses 20,000 units and adds institutional sales. Add local bench for top 2 SKUs.
- Year 4 to 5: in-region partner contract signed, partner trained on firmware flash and OID calibration.
- Year 6: in-region partner covers 80% of events; factory-direct covers the remaining 20% (firmware, slow movers, depot-level rework).
A common mistake is to migrate too early. A distributor who signs a partner contract at 8,000 units/year burns cash because the partner's minimum monthly volume is 200 events and they only generate 110. Either grow to the partner's minimum, or stay on factory-direct.

13. Related Reading
- Reading Pen Warranty Policy for Distributors
- Reading Pen Return Rate: Industry Benchmarks
- Reading Pen Return Policy
- Reading Pen Troubleshooting Playbook
- Reading Pen Inventory Management for Distributors
- Reading Pen Distributor Management
- OEM Reading Pens
- Request a Quote
If you are choosing between factory-direct, in-region partner, and hybrid for your territory, reply to any email from the Smart Reading Pen team with the word SERVICE and we will send you the cost-stack calculator (Excel, 2 sheets) populated with your projected SKU mix and annual volume.